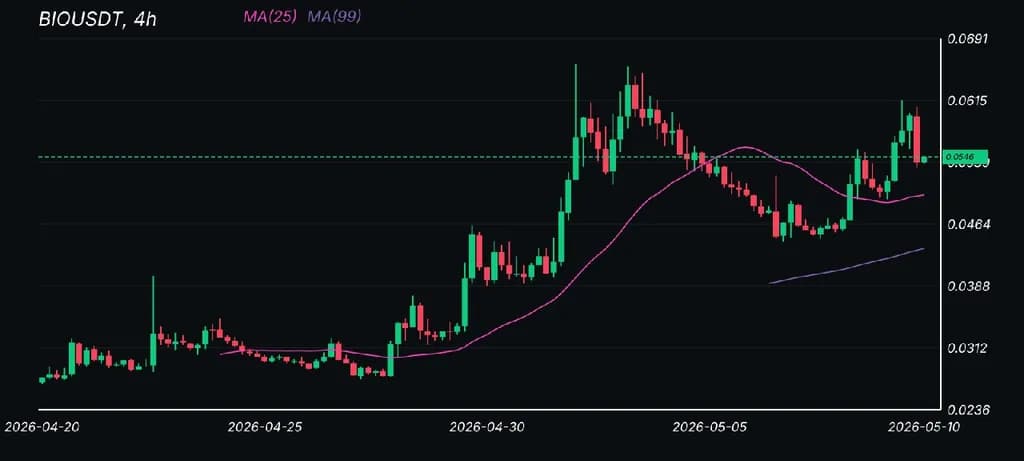
This chart depicts the price movement of BIOUSDT on a 4-hour timeframe, highlighting the dynamics between short-term (MA 25) and long-term (MA 99) moving averages. The upward trends and corrections reveal active market fluctuations and potential entry points. Its clear layout and detailed indicators make it a valuable asset for traders seeking to analyze momentum and trend shifts. This analytical visualization would complement any trading strategy collection.
Artiste
I blend history and modern life through art, capturing moments from ancient pyramids to cosmic scenes. My work explores contrast, isolation, and imagination, inviting viewers to find calm, energy, or mystery in each piece.