Beschreibung
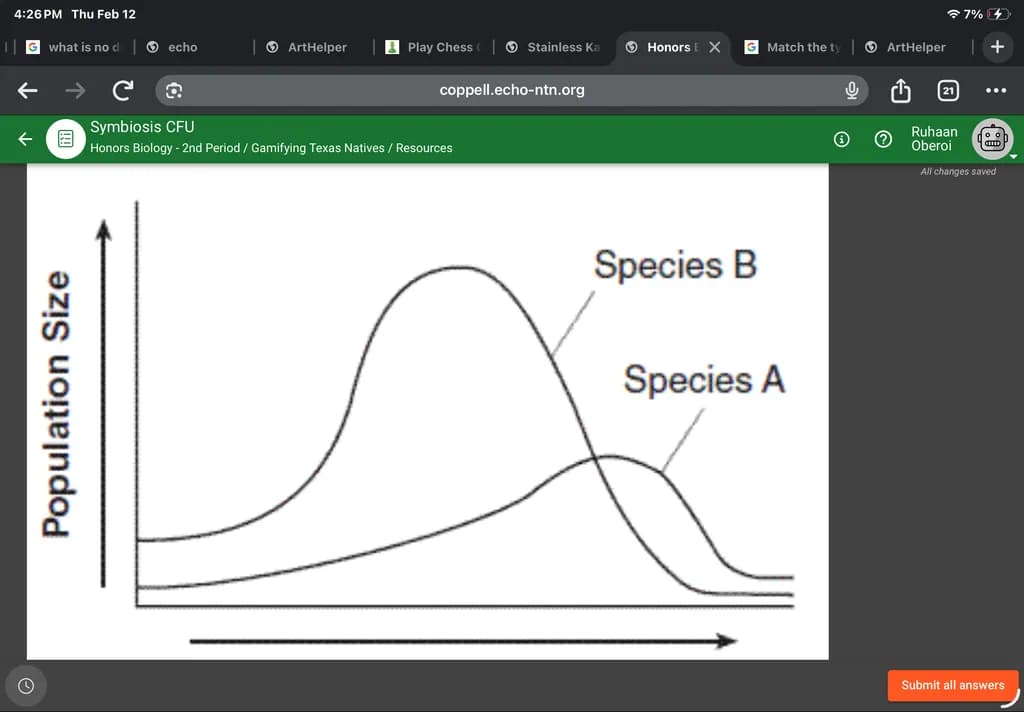
This graph presents the population dynamics of two species, A and B, over a given period. Species B exhibits a sharp rise and fall in population, while Species A shows a more gradual increase and decline. The contrasting patterns highlight differences in growth and decline rates between the two species. This visual resource is an insightful addition for anyone exploring ecological interactions and population trends.