Beschreibung
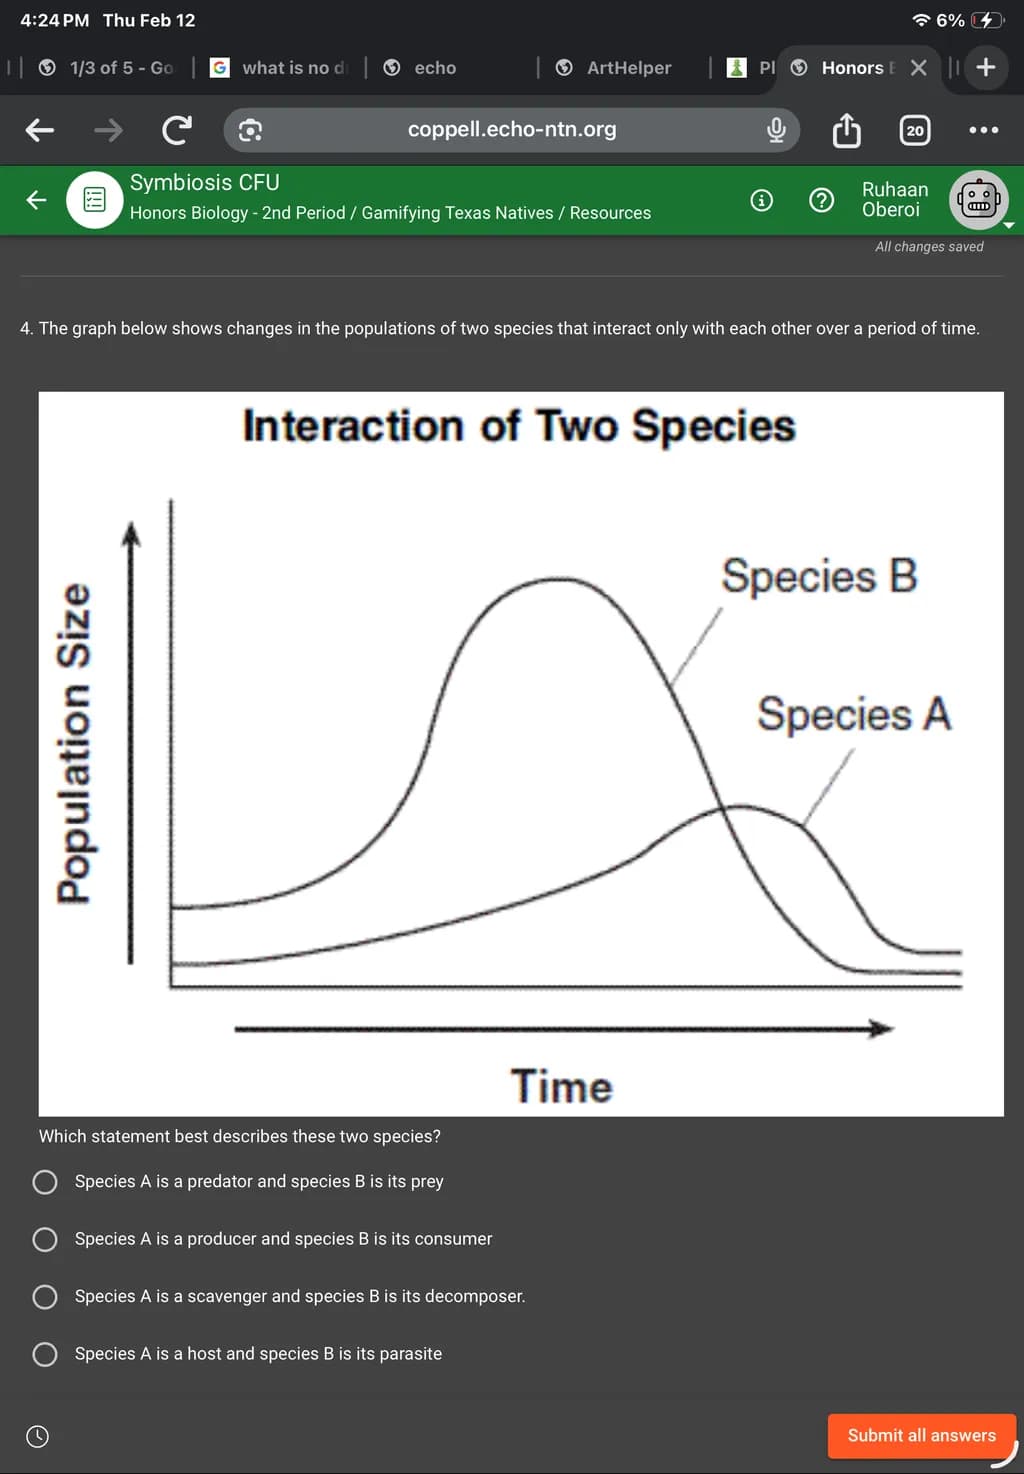
This graphic presents the population dynamics of two interacting species over time, illustrating the fluctuating relationship typical of predator-prey systems. Species B peaks in population before declining sharply, while Species A’s numbers rise more gradually, suggesting a dependent interaction. The clear curve reveals the interplay between growth and decline in both populations, making this piece a thoughtful addition for those intrigued by ecological relationships and natural cycles.